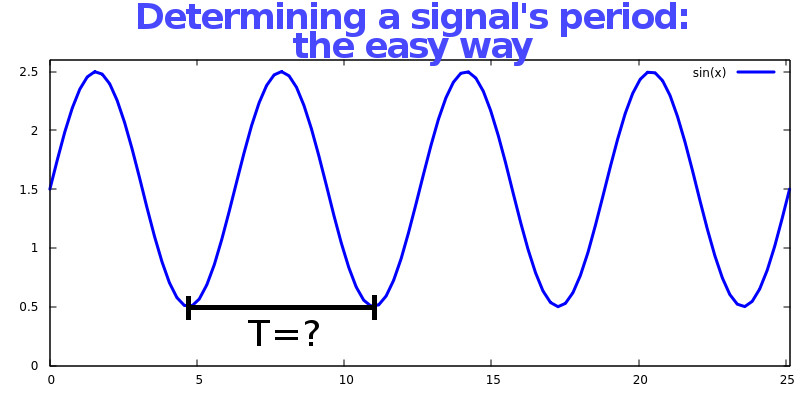
I’ve recently had to determining the frequency of some arbitrary repeating signal, from a stream of sampled values.
In a simple universe, you could just wait for a specific value to come in–say the peak value–or monitor for the zero crossing or somesuch.
However, the particulars in this case included the fact that, in addition to the unknown period, we couldn’t predict the amplitude of the signal, the amount of noise present and, though it would be sine-like, we didn’t even know its specific shape.
This got me thinking about how to best handle the task and here are the results.
A first go
At the start, I was presented with some general ways to perform peak detection with the idea that we’d see the time interval between peaks and thus have our signal’s period. This presents two major obstacles:
- You’ve got to track time: meaning you need to know when the last peak happened, which I find annoying; and
- Peak detection just isn’t that much fun.
By the second point, I mean that doing it correctly within the constraints of our quasi-arbitrary signal is hard. And hard is to be avoided when possible because hard is usually complex, which is tough to maintain and slow, and because hard is… hard. Why bother?
This tack on the problem turned out to be a red herring, as peak detection really isn’t required to find the period anyway: any specific event that occurs one time per cycle will do.
So here I present the approach taken. Of course, this method applies when you’re getting a continous stream of values and can afford to get your results after some period of time that is longer than signal’s period–the bigger your sampling time compared to the signal period, the better–and assumes you can actually know how long each sampling run is.
The Method
In short, you just use the magic trick that keeps your thermostat from going crazy: hysteresis.
Your very first sampling run is thrown away, and just used to determine the maximum value of the signal, Vmax.
In pseudo code:
	vmax = 0;
	while (amSampling) {
		if (currentSample > vmax)
			vmax = currentSample;


		// do other stuff with your sample,
		// get next sample, figure out that we're
		// done sampling etc.
	}
So nothing magical there, though it could be tweaked and optimized if run time is crucial, and fixed to deal with some issues described below.
Now we process the result of our vmax determination by calling:
function updateThresholds() {


	half_max = vmax/2;
	hyst_delta = half_max/HYST_FACTOR;

	upper_threshold = half_max + hyst_delta;
	lower_threshold = half_max - hyst_delta;
}
Ok, so now we’ve determined some threshold bounds around the mid-point of our last sampling run’s maximal value. HYST_FACTOR is some number that you have to guesstimate based on your signal’s properties, namely the amplitude and amount of noise. Make it too big, and you’ll get false positives. Make it too small and you’ll miss events. Start with something between 3 and 8 or so, I dunno.
Now that we’ve got our thresholds, future sampling runs look a little different:
	am_below_threshold = true;
	numCrossings = 0;
	vmax = 0;
	while (amSampling) {
		// we still want to track vmax, in case it changes
		if (currentSample > vmax)
			vmax = currentSample;


		if (am_below_threshold) {
			// we were below the threshold
			if (currentSample > upper_threshold)
			{
				// we were below and we've just crossed over
				// our upper bound marker...  this counts!
				numCrossings++;

				am_below_threshold = false; // no longer below
			}
		} else {
			// we were above the threshold
			if (currentSample < lower_threshold)
			{
				// but now we're definitely under
				am_below_threshold = true;
			}
		}

		// do other stuff with your sample,
		// get next sample, figure out that we're
		// done sampling etc.

	}
So, now we have a new vmax but, more interestingly also have a count of the number of times we crossed the threshold while going “up”. With that we can now get
	frequency = numCrossings/totalTimeSpentSampling;
	period = 1/frequency;

	// do whatever we wanted the frequency/period for

	// don't forget to update our thresholds as above
	// after every sampling run, assuming vmax is
	// likely to change
	updateThresholds();
Here’s what this method looks like when run in scilab, with a great deal of random noise added to the sinusoidal function:
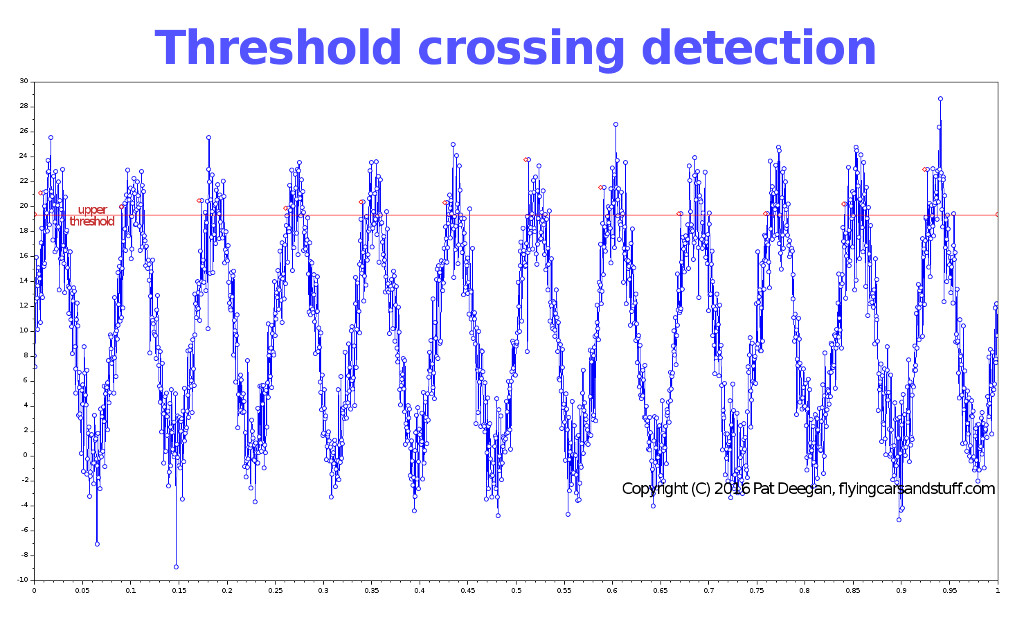
The red line is the upper threshold, and each detected crossing is marked as a red dot. Not bad at all.
Caveats
Note that there is some error introduced if your sampling runs don’t last an integral number of signal periods. The trade off is between error and snappiness: the error goes down as the length of the run becomes larger and larger, so the more frequently you want the period updated, the greater the potential error.
Another issue is if your signal’s amplitude varies wildly. In that case, having a very long sampling run could lead to issues as the old vmax, and the derived thresholds, no longer applies.
If the noise on the line is so large that your samples can bound around repeatedly between being below the lower threshold and above the upper, then you’re gonna have a bad time. Decrease the HYST_FACTOR value or try and reduce the amount of noise.
Finally, noise can also be a factor in your threshold bounds determination. Take a look at the last peak in the image–it’s waaay up there. Because of the simple manner in which we’re determining vmax, this outlier actually determines vmax for the next run, meaning the bounds may be so high that you miss some or all of the crossings in the next sample run. I leave fixing this as an exercise for the reader.