Received a Hantek DSO-2090 USB oscilloscope today and put it through a few paces. Here are the results and my impressions from using the device a bit, as well as a few tips for working with it under Linux.
The first thing to note is that, in terms of DSOs, this thing is dirt cheap and (as usual) you get what you pay for. My Tektronix scope is positively ancient and yet it still beats the Hantek in many regards. Still, I’m quite happy with the purchase. Here’s what I received:
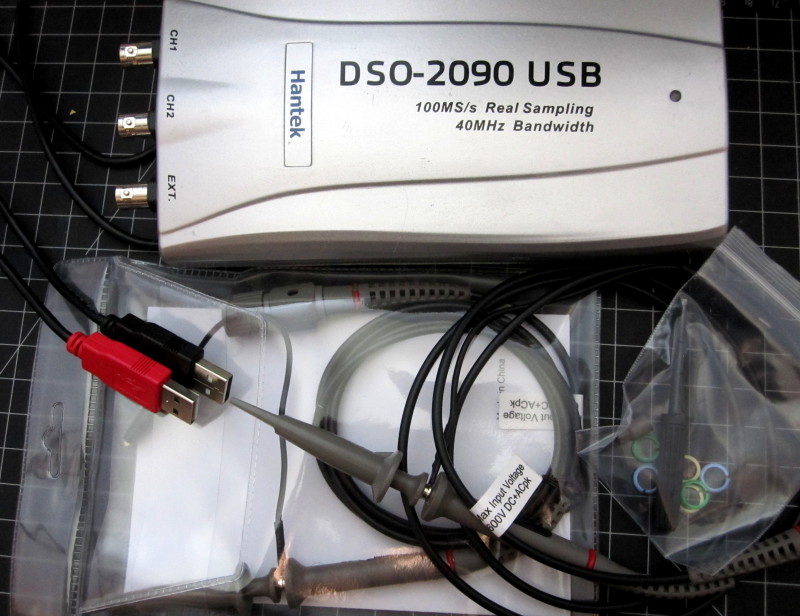
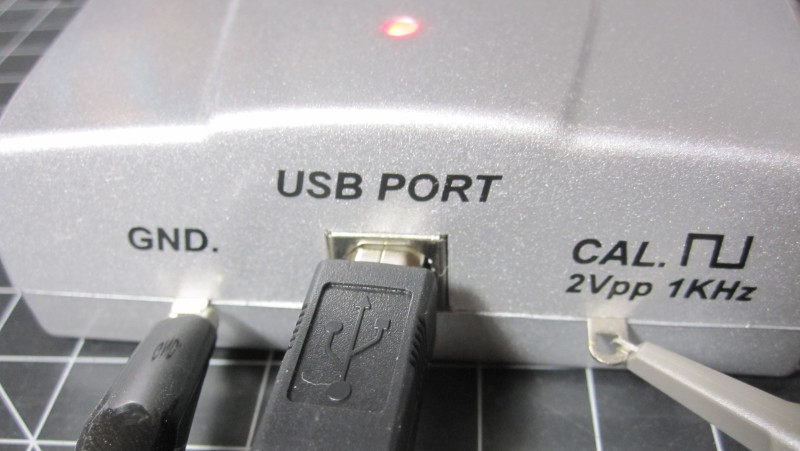
In addition to the scope module itself, my package came with two probes (both with an x1/x10 selector) and a USB cable. There were no instructions to speak of but the USB cable has two USB connectors, one of them red, so I gather the thing requires more juice than a single port can provide.
Installation
 I got it running with both connectors hooked up to my laptop as well as with only the black connector in the laptop and the red connector in a phone charger—but this is probably risky if there’s any chance that the grounds aren’t at the same level, and at one point I was messing with the plug and my laptop suddenly shutdown. Oops. Thankfully, nothing was fried but I think I’ll just have them both in a powered USB hub from now on.
The first time I plugged it in, the computer detected the device and then… nothing.
The fact is that the device is pretty dumb on its own: the firmware needs to be loaded every time it’s powered up.
For windows™, you can get the drivers and follow the directions on the hantek DSO2000 series page.
With Linux there are two routes you can take, in theory: sigrok (which didn’t go so well for me) or OpenHantek (which I’m pretty satisfied with).
Sigrok
Sigrok is nice in that you can probably install it through apt-get, like I did, or whatever your distribution’s repository system is. On the downside, you’ll have to get the driver firmware for the DSO from the Hantek site, extracting it from the windows driver as directed and moving the contents over to /usr/share/sigrok-firmware/hantek-dso-2090.fw as directed in the sigrok documentation. With the module plugged in, and the firmware in place you can use sigrok-cli which will detect the module and upload it’s firmware. Scan and show both work fine:
$ sigrok-cli --scan
The following devices were found:
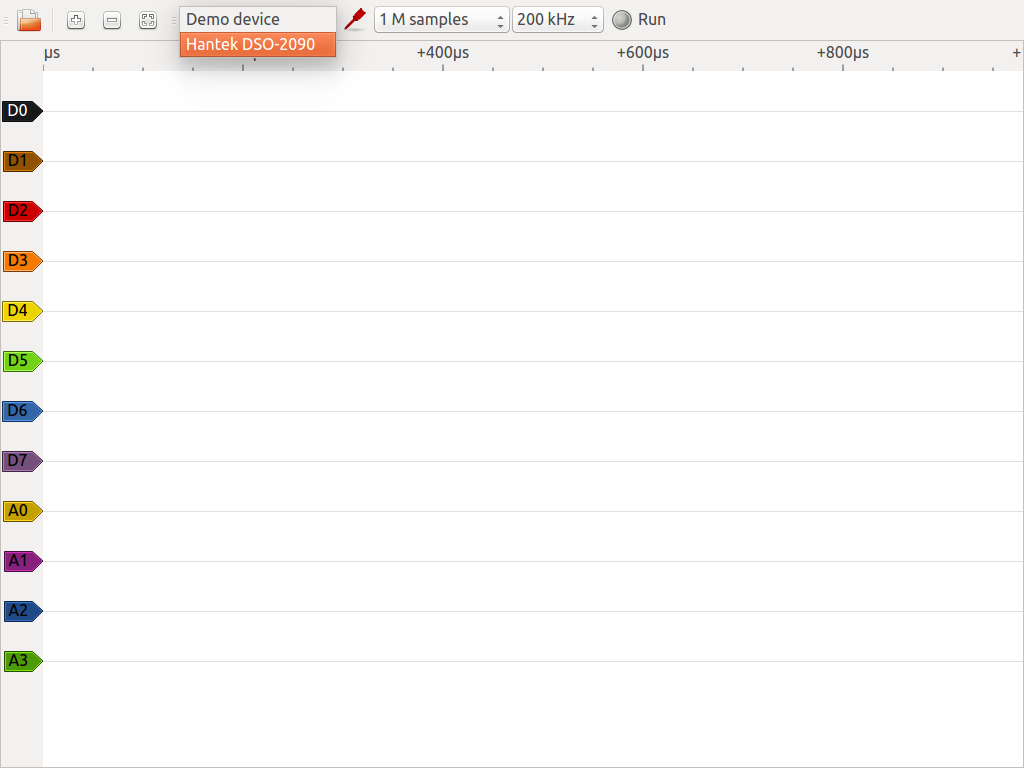
demo - Demo device with 12 channels: D0 D1 D2 D3 D4 D5 D6 D7 A0 A1 A2 A3
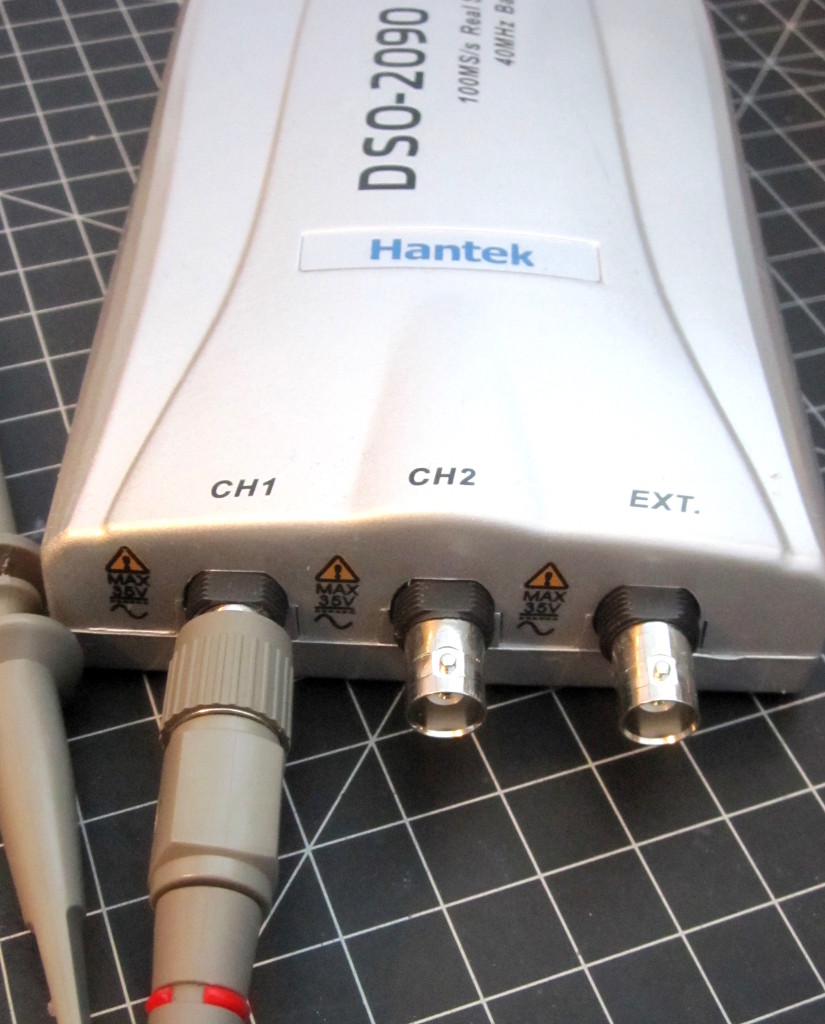
hantek-dso:conn=2.15 - Hantek DSO-2090 with 2 channels: CH1 CH2
$ sigrok-cli --driver hantek-dso --show

hantek-dso:conn=2.15 - Hantek DSO-2090 with 2 channels: CH1 CH2
Supported driver options:
    conn
Supported configuration options:
    timebase - supported time bases:
      10 us
      20 us
      40 us
      100 us
      200 us
      400 us
      1 ms
      2 ms
      4 ms
      10 ms
      20 ms
      40 ms
      100 ms
      200 ms
      400 ms
    buffersize - supported buffer sizes:
      10240
      32768
    triggersource: CH1, CH2, EXT
    triggerslope:
    horiz_triggerpos
    filter: CH1, CH2
    vdiv - supported volts/div:
      10mV
      20mV
      50mV
      100mV
      200mV
      500mV
      1V
      2V
      5V
    coupling: AC, DC, GND
Another, pretty important, downside is that the only non-empty output I managed to get from sigrok was the semi-useful ‘analog‘ output format, using commands like:
$ sigrok-cli -d hantek-dso \
  --config "coupling=DC:vdiv=500mV:timebase=100ms" \
  -C CH1 -O analog --continuous
As the gnuplot output kept giving me errors like:
sr: output/gnuplot: No logic channel enabled.
I figure this is only for logic analyzers, though the documentation is unclear (from my quick perusing, anyhow). Other types of supported output just did nothing at all, apparently failing silently.
Analog output does work, and sticking my finger on the probe produces output. To visualize actual data, I helped things along with the command line to massage the output a bit and save it to a file by doing
$ sigrok-cli -d hantek-dso –-config "coupling=DC:vdiv=500mV:timebase=100ms" \
   -C CH1 -O analog --continuous 2>&1 | sed -e 's/CH1: //' -e 's/ .*//g' | grep \
   -v FRAME | nl > /tmp/lala.txt
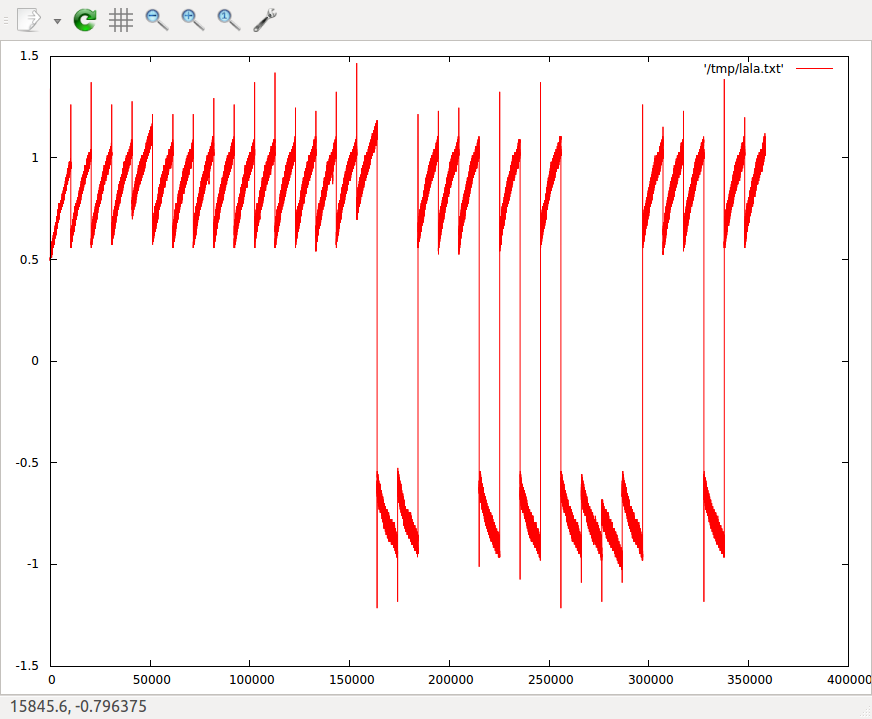
This produced a “/tmp/lala.txt” file containing stuff like:
     1  1.341177
     2  0.509804
     3  0.494118
     4  0.509804
     5  0.494118
     6  0.509804
     7  0.494118
     8  0.509804
     9  0.494118
    10  0.509804
And from there, telling gnuplot to
gnuplot> plot '/tmp/lala.txt' with lines
output this kinda weird plot:
I also tried to run pulseview (logic analyzer using the sigrok backend) to see what would happen. The program actually detects the Hantek
but pressing run eventually leads to a segfault with
pulseview: /build/pulseview-MTrAEt/pulseview-0.2.0/pv/sigsession.cpp:551:
  void pv::SigSession::feed_in_analog(const sr_datafeed_analog&): Assertion `probe' failed.
Aborted
All right, so sigrok works ok and there’s probably great potential with it—I really like the idea of a backend for logic analyzers, DMMs and DSOs, independent of front-ends… but I also like to see the waveforms without mucking about with gnuplot. Enter OpenHantek.
OpenHantek
OpenHantek is free Linux/Mac software for Hantek (Voltcraft/Darkwire/Protek/Acetech) DSOs by Oliver Haag. I grabbed the freshest source from the github repo and it compiled without a hitch. However, it SegFaulted when trying to connect to the scope. So much for bleeding edge.
Whatever: the release on github worked fine (actually the .deb had a bunch of missing dependencies, but the pre-compiled binary works well).
OpenHantek actually includes the firmware needed for a number of Hantek scopes, which is cool. You do need to putz around a bit to get your system to actually load it. In short, you install the relevant loader/firmware hex files somewhere, say /usr/local/share/hantek/, and then add a few rules to udev.
For the DSO-2090 these are:
# Hantek DSO-2090
SUBSYSTEM=="usb", ACTION=="add", ENV{DEVTYPE}=="usb_device", \
   ENV{PRODUCT}=="4b4/2090/*", \
   RUN+="/sbin/fxload -t fx2 -I /usr/local/share/hantek/dso2090x86-firmware.hex -s /usr/local/share/hantek/dso2090x86-loader.hex \
   -D $env{DEVNAME}", SYMLINK="dso2090", MODE="0666"

SUBSYSTEM=="usb", ACTION=="add", ENV{DEVTYPE}=="usb_device", \
   ENV{PRODUCT}=="4b4/8613/*", \
   RUN+="/sbin/fxload -t fx2 -I /usr/local/share/hantek/dso2090x86-firmware.hex -s /usr/local/share/hantek/dso2090x86-loader.hex \
   -D $env{DEVNAME}" ATTRS{idVendor}=="04b5", \
   ATTRS{idProduct}=="2090", MODE="0660", GROUP="plugdev"
With the fxload commands pointing to the correct location for the firmware hex files. I have a single udev rules file where I add all my custom rules to make things easy to backup. Do the same, or use a custom file, doesn’t make much difference as long as the files is along with the others, probably in rules.d/.
Then you install fxload, if not already present on your system. Easy with Ubuntu:
$ sudo apt-get install fxload
and finally, unplug the DSO (if you’ve been playing with sigrok/if it’s plugged in) and refresh udev. For this, I just use:
$ sudo udevadm control –reload-rules
$ sudo udevadm trigger
From there, when you connect it to USB, the firmware will automatically be uploaded. If the red light is blinking you might think it’s an error, but no, that actually means all is well (but nothing is connected to the DSO).
Launch OpenHantek and you’ll probably hear some pretty scary clicking. I think the inputs have relays on them and it seems this is normal. If you’re in a brightly lit environment, the LED on the oscilloscope may seem to go off, but it’s actually blinking green while sampling.
With a probe plugged into channel 1 (CH1) and selecting CH1, 1V, DC (more clicks), I hooked up the probe to the calibration lug on the back.
Nothing. However, putting the OpenHantek trigger in Auto mode and changing the timebase down to 10ms or less and I started seeing some action.
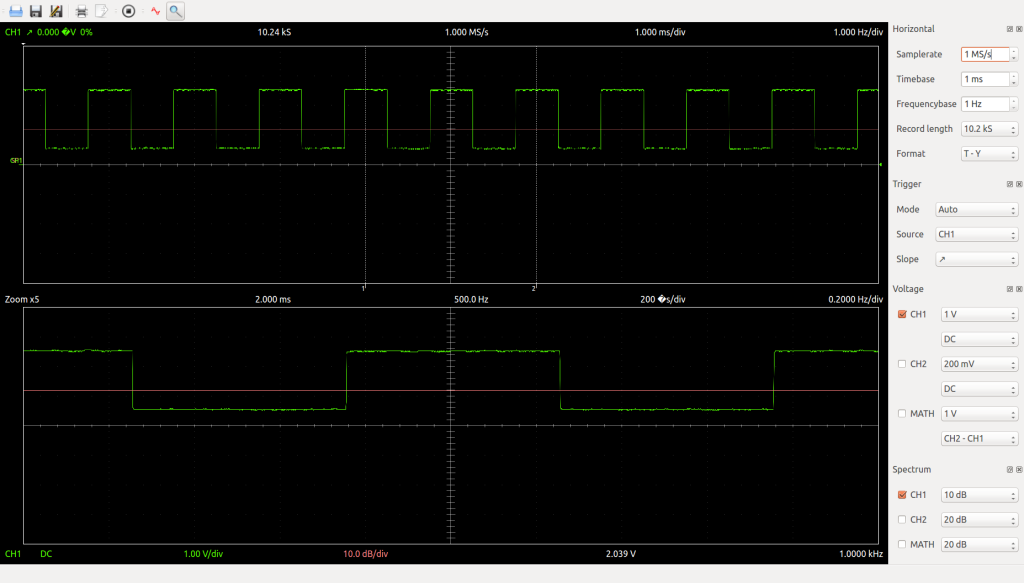
Nice. Note the stats at the bottom right of the screenshot: 2.039V and 1.000 kHz – ok, looks sane and the spectrum analyzer seems to be doing well too.
Next, I hooked up and Arduino that was setup to do some PWM on pin 3 and simply toggle another pin as fast as it could (since this was Arduino code, and there’s a ton of overhead in calling digitalWrite(), this isn’t all that fast, but good enough now). So, nothing more complex than:
void setup() {

   // set as outputs
   pinMode(2, OUTPUT);
   pinMode(3, OUTPUT);

   // enable PWM on pin 3
   analogWrite(3, 64);

}

void loop() {

   // loop as fast as possible, toggling pin 2
   for (;;) {
      digitalWrite(2, HIGH);
      digitalWrite(2, LOW);
   }
}
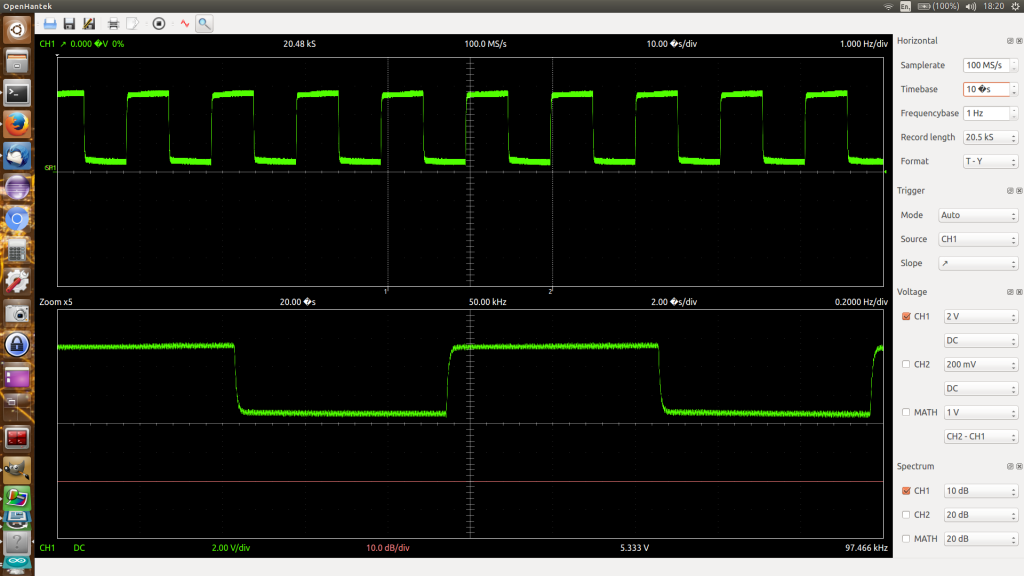
The scope did fairly well here:
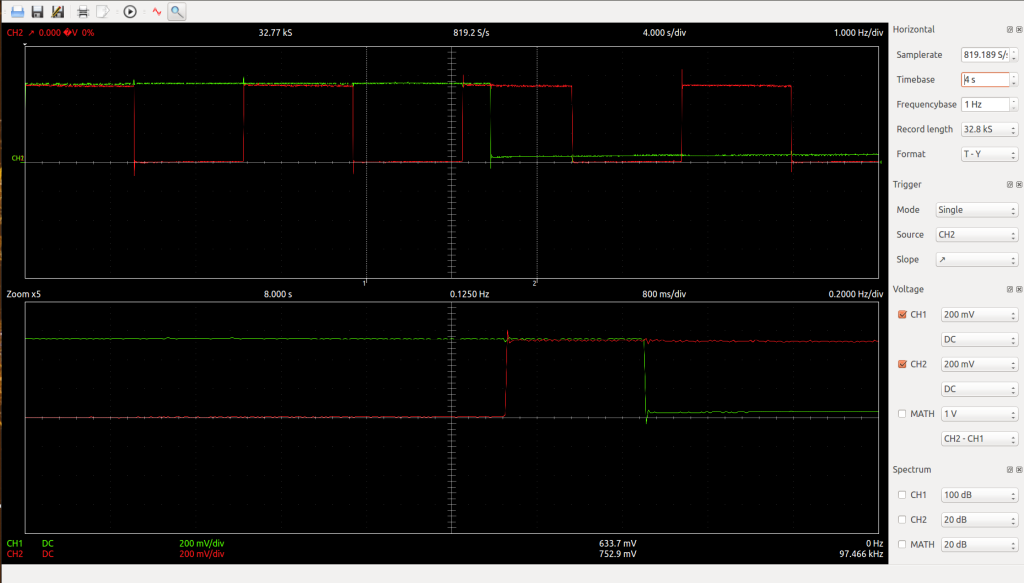
A few things to note, from the above screenshot. One is the zoom function, which I liked: it allows you to focus in on the center of the trace (shown in the bottom half).
Another is that you can actually see some ringing when the levels change. Not as much, nor as pretty, as with my “real” scope, but that’s pretty promising.
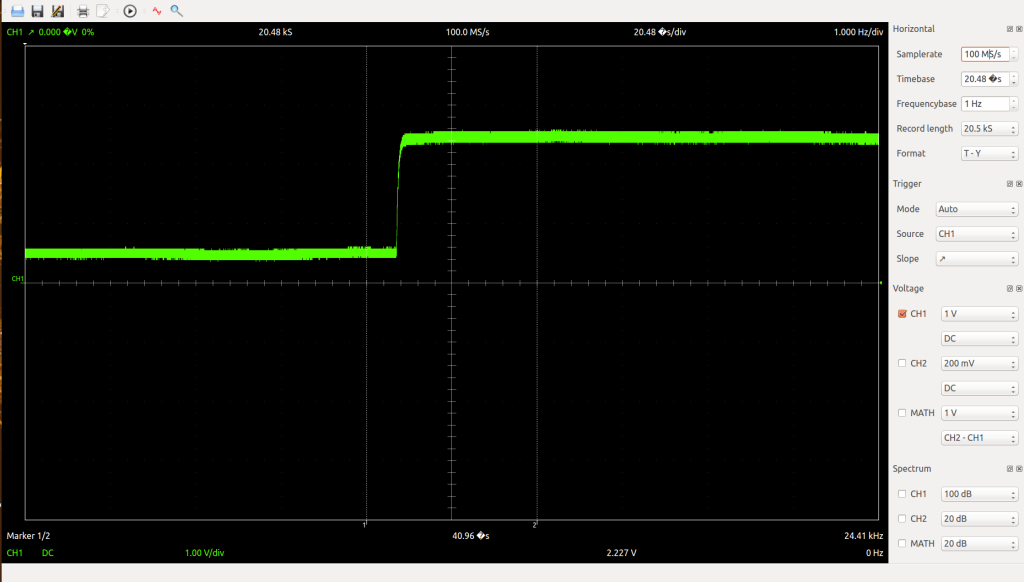
The final thing this screen reveals is a recurring problem with this version of OpenHantek. If you notice, the samplerate/timebase (4 seconds!) don’t jive with my description. The fact is that that square wave has a period of somewhere around 10 microseconds. Here’s another capture, this time with the correct values displayed:
There are some bugs in the program that cause my settings to jump around everytime I move the focus to another widget or even use another window. It’s pretty annoying, as the timebase will move to some large value, for example 20.48 seconds (??), and then the screen/captures seem to just freeze.
The triggers are tricky too. Normal and Single work, sometimes. Auto works most of the time but causes a lot of jitter in the display.
Still, the program is nice work: I get a graphical display, the two channels and math functions working well. The results of the spectrum analyzer are sometimes kind of off or weird, but I don’t know if this is the front-end or the DSO… sometimes it seems to work well, too.
Finally, though the scope is supposed to go up to 100 megasamples/second (and I’ve even heard it can be overclocked, with a little hardware mod to the oscillator), I’ve found that setting to be a lot noisier. Here’s a signal sampled at 50MS/s with about 20us/div (click to zoom in):

and here’s the same signal and time division, but at 100MS/s:
Zooming into the 100MS/s sampling, you can see a pretty regular triangle wave in the 1 or 2 LSBs of the sampling:

I’m not certain where this is from. In any case, most of what I see myself doing with this scope is more along the lines of this screenshot:
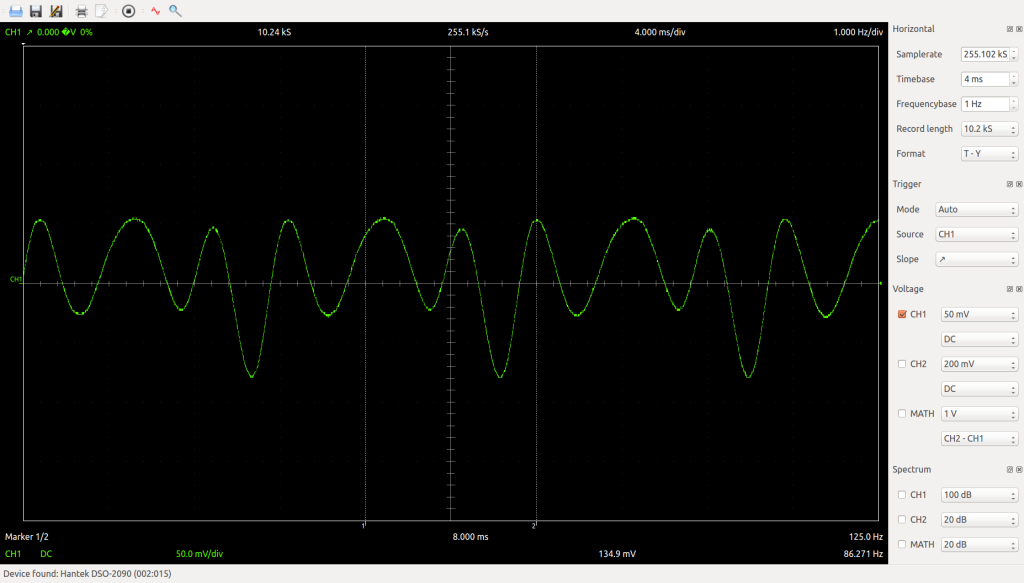
This is the raw output from an electric guitar. Looks like I need some tuning, but that 86Hz signal is just about what I’d expect from a low E (about 82Hz), and it’s pretty too.
Conclusion
 For the most part, I’m pretty satisfied with this device–especially considering it was about 60 bucks! It can’t replace a professional oscilloscope, and you won’t be doing high frequency RF work with it. But for light work and regular field duties, I’m quite happy.
There’s definite room for improvement on the front-end side of things, as far as I can tell, but on one hand I’m not yet running the latest version of OpenHantek or the latest version of the DSO firmware, so that might improve things. On the other, the awesome thing about OpenHantek and Sigrok, in addition to the great work that’s already been done, is that they’re open sourced: it should be possible to fix anything I’m really annoyed with or add whatever I’m really in need of and both scratch my own itch as well as contribute back.
I’m excited to see how I’ll be able to put this little device to use, and hope this document can help you out if you’re in similar circumstances.