Trying to implement a Zigbee device involves a few challenges, but things get a whole lot easier when you aren’t operating blind.
I’ve got my prototype built and running, based on an nRF5340 and the Zboss stack, and also have a few commercial hubs to play with.
I started out naively thinking that if I implemented things nice and standards-compliant, associating with a hub would be pretty simple. After a few hours of mucking about, the smartthings hub just wasn’t cooperating.
I could get it paired as a light, or a switch or an outlet… but only a single endpoint would ever show up in the app. Sometimes it would bind and appear as a thermostat—I have a temperature sensor in there, but no clusters related to thermostats at all. Some endpoint/cluster combinations just produced a “Thing” with no controls whatsoever. What the hell’s going on?
Ok, so maybe starting with a commercial hub and app wasn’t the best way to get going. How could I know if the hub was misbehaving, in all likelihood my code was in need of enhancements… Too many variables. Backing up a bit was in order, so I could at least get a view of the big picture.
An obvious option is to control both ends of the equation. In fact, I had a network controller running on another prototype board, based on the nRF network coordinator sample so I could at least run both devices and setup some monitoring on each end. It would mean digging into the Zigbee stack, customizing some code…
But I’m as lazy as I can be, uhm I mean efficient. So the first thing was to see if my endpoints were actually being reported as I thought, and what the exchanges actually look like on-air.
Other than the obvious advantage of not having to play with code on two MCUs, another upside is that this works whether you have access to device internals or not.
Grabbing packets
So we want to sniff some zigbee traffic and see what’s really going on behind the scenes.
Since the ICs already have radios to get into the bands, we could always use those to grab the messages. Nordic actually has an 802.15.4 sniffer that may be used on their chips.
But on one hand it means another layer of software to deal with and debug and, at least with Nordic, I have a gift of stumbling across the edge cases… no time for that.
Also, I wanted a more generally applicable solution, something useful when I’m not playing with bunch of nRF prototypes .
There are two relatively easy and universal options for sniffing zigbee packets.
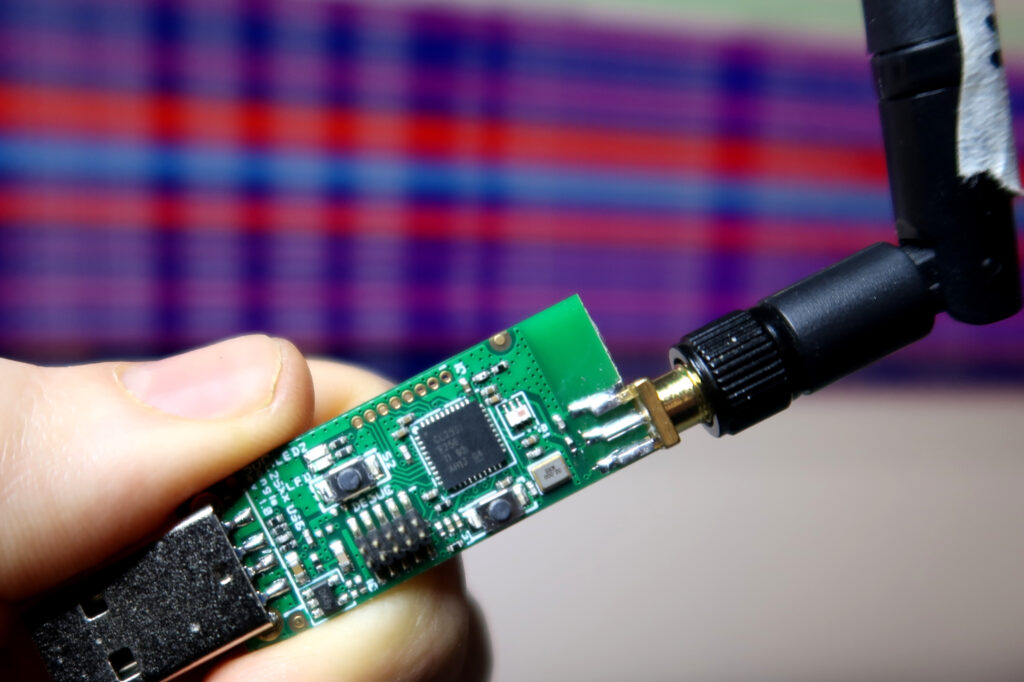
Option 1: CC2531 sniffer dongle
There are a ton of cheap USB dongles available based on the T.I. CC2531.
These can do anything IEEE802.15.4 related and there’s sniffer software available from TI that works well. I ordered a cheap Chinese version and it came pre-loaded with the sniffer (I think… I burned the original TI firmware on it before sticking the thing into the USB port of my computer, which I think is a sane practice but requires the CC-debugger to burn it).
From there, it’s just a question of using whsniff, which will spit out binary packet captures as they come in. Something like:
$ /path/to/whsniff -c 12 > /tmp/zigsniff.pcap
works well. If you know the channel, that is… If you don’t know it, you’ll have to either get the network coordinator to tell you somehow, or channel surf until you find a channel with activity, ideally one that kinda correlates with your orders to identify or scan for new devices.
For some reason I cannot fathom, zigbee channels start at 11 and go up to 26. mk.
Running the sniffer one channel at a time is pretty annoying and this is one of the reasons I tend to prefer option 2. Also, the dongle I ordered took a while to get here and on top of being lazy I am impatient as well.
Option 2: SDR
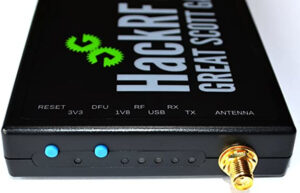
Examples here will use my trusty Hack RF One but you can use any software defined radio that makes it up into the 2.4GHz ISM band to play with 802.15.4 packets (and also wifi and bluetooth and whatever else is around—wow, I sure love SDR!).
With SDR and GNU radio, you can not only sniff a single channel but capture many channels at once, inject your own packets and more. Here we’ll just grab them out of the air.
I have used Bastian Bloessl’s 802.11 (a/g/p wifi) magik before and it’s terrific. He also released a set of blocks, gr-ieee802-15-4 for what we need here. So, first step is getting that installed.
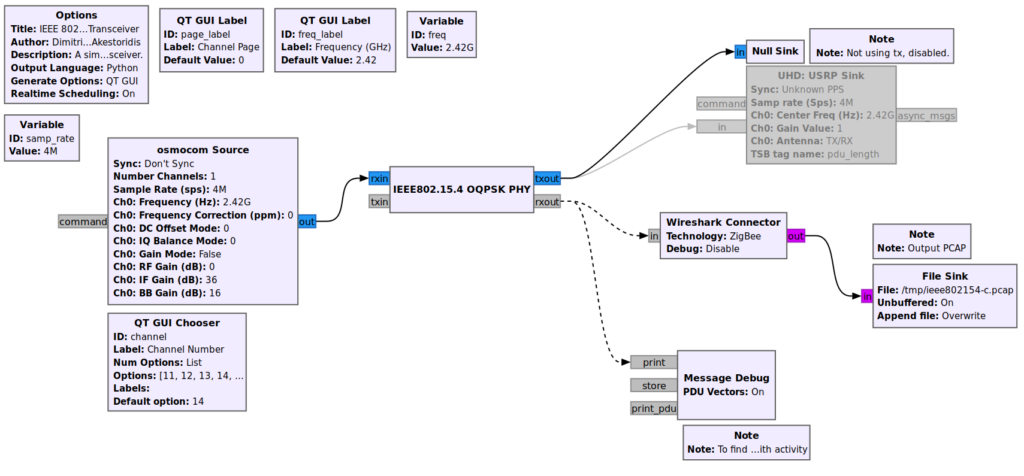
Then I took the transceiver flow graph from grc-ieee802154 and modified it a bit to make it easier to find channels of interest.
I replaced the input with the osmocom source to get samples from the HackRF, disabled the output stuff because I don’t want to send, and added a little live debug (the PDU Message Debug block) to see what’s going on with the selected channel, shown in lower left below.
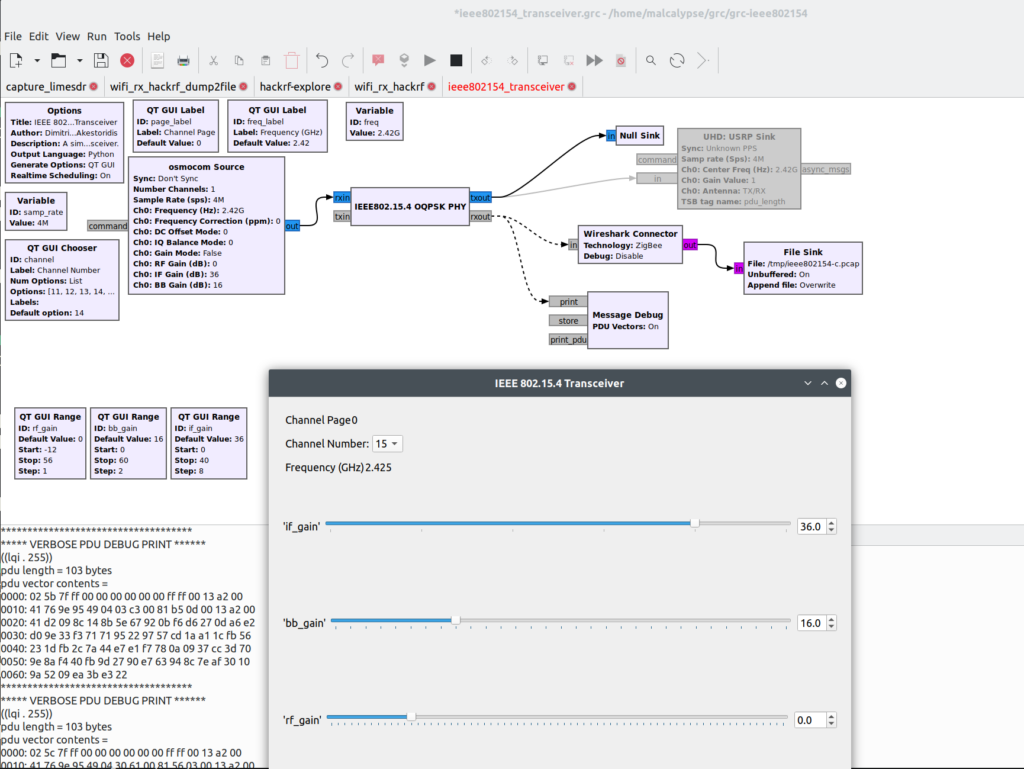
Whichever option you use, the idea is to end-up with a growing pcap file that has all the capture goodies within.
Inspecting the packets
My favorite way to go deep with the packets is of course wireshark. You can either load the pcap once it’s all done, but I like to view the data as it’s coming in. To do this, I have a little shell script that is basically:
$ tail -f -c +0 $FILENAME | wireshark -k -i -
Another thing I set up was some nice and super clear coloring rules. In addition to that simplified flow graph, Dimitrios-Georgios Akestoridis has also shared a pretty sweet set of rules for zigbee.
Now that you’ve got some packets to inspect and a nice way to do so, the next hurdle is encryption. Everything on a zigbee mesh is encrypted, at least once. There’s a network key, that changes periodically, and their can be link keys between particular peers.
If you don’t get that key, then your packet dumps will be a whole lot of nothing.
The hole in this encryption scheme is on-boarding the dumb cousins of the zigbee world: all the stuff that’s too simple to bother with having some side-channel to communicate symmetric keys for.
In those cases, there is the one true key. This is a default global trust center link key, defined by ZigBee, that everything must support.
When a new device comes up to be associated to the network and there’s nothing better available, this key gets used during a short window, to encrypt the traffic used to send over the current network key. This is why DoS attacks were a thing against zigbee devices, to get the owner to come out and reassoc, thereby exposing that key exchange a huge chunk of network (basically everything not using link keys).
So, the recipe is to add this key to wireshark’s set, through:
Edit → preferences → Protocols → Zigbee → Pre-configured keys
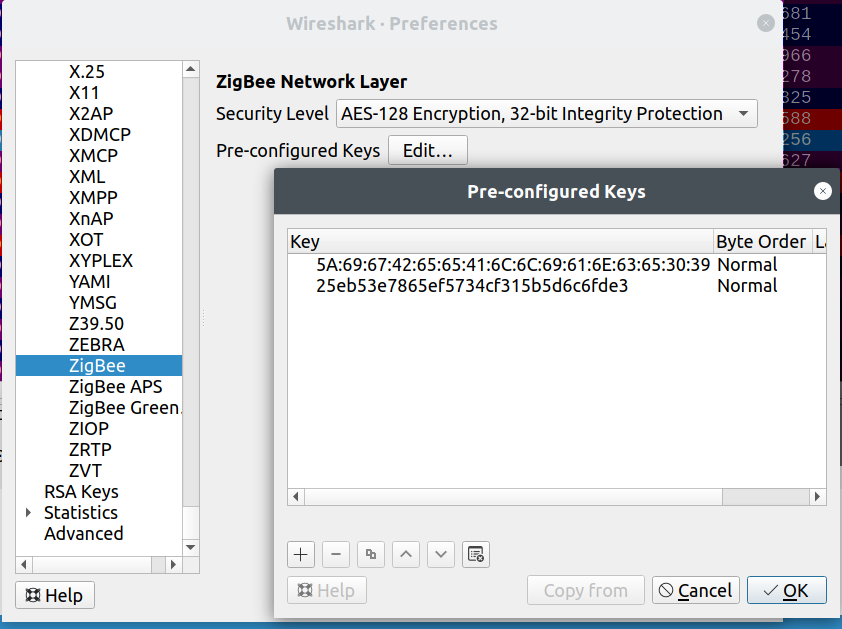
If you:
- enter keys that you already know were being used; or
- have a device with no preconfigured keys and associated to the network while you were sniffing
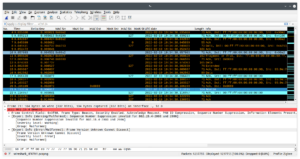
then the loaded packets will be parsed again and decrypted this time, yielding a beautiful rainbow.
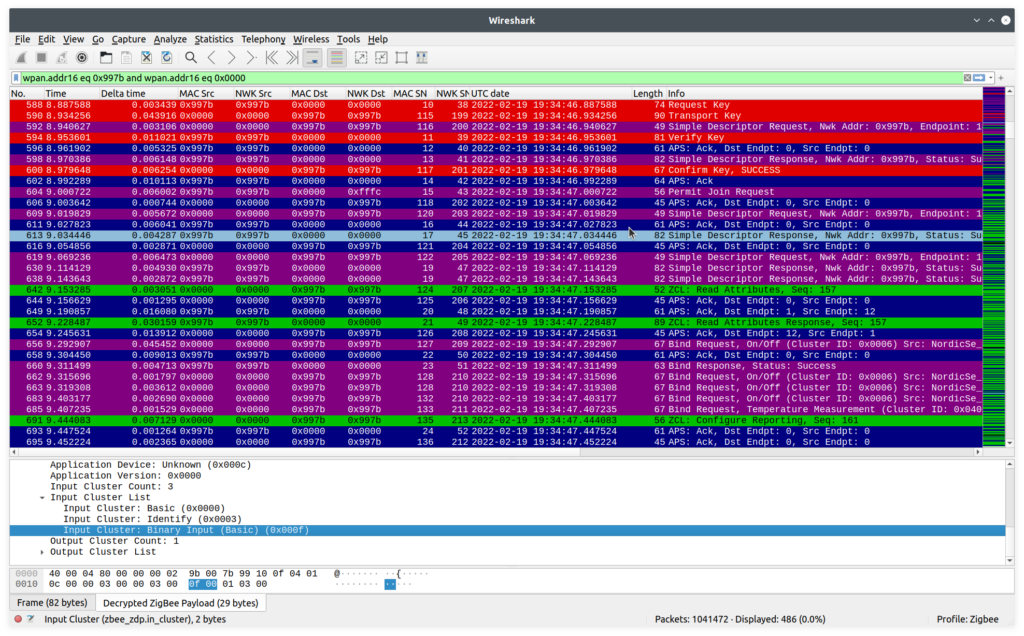
And the great news is that wireshark is smart. See those red entries? We’re not just intercepting the key exchange, wireshark is using the keys exchanged inside those packets to automatically decrypt the following packets.
All these guys have a security header, within the network layer data, that shows which key is being used:
      ZigBee Security Header
         Security Control Field: 0x28, Key Id: Network Key, Extended Nonce
             ...0 1... = Key Id: Network Key (0x1)
             ..1. .... = Extended Nonce: True
         Frame Counter: 163920
         Extended Source: TexasIns_00:1c:a7:7b:08 (00:12:4b:00:1c:a7:7b:08)
         Key Sequence Number: 0
         Message Integrity Code: 66c76f0b
         [Key: 3c9d024899de5d42d2c4c663e7bb7291]
         [Key Origin: 3821]
It even tells you which packet it got the key from (number 3821, in Key Origin). Nice!
Actually using message captures
Depending on what you’re working on, different packets will be of greatest interest. I’ll describe a few I’ve found most useful.
After announcing itself, during the network join, the controller will query the device to know which endpoints are available. To see what the device is really answering, find the Active Endpoint Response which will contain something like:
 ZigBee Device Profile, Active Endpoint Response, Nwk Addr: 0x01cb, Status: Success
     Sequence Number: 71
     Status: Success (0)
     Nwk Addr of Interest: 0x01cb
     Endpoint Count: 7
     Active Endpoint List
         Endpoint: 12
         Endpoint: 10
         Endpoint: 11
         Endpoint: 13
         Endpoint: 14
         Endpoint: 15
         Endpoint: 16
This isn’t often super useful, but it’s a sanity check and actually allowed me to catch a dumb mistake where I had two endpoints with the same id. Not sure how the zboss stack was handling that, but it couldn’t be great.
After that, the hub or router will query each endpoint for a description of what’s available. The Simple Descriptor Responses will show what’s up. For example
 ZigBee Device Profile, Simple Descriptor Response, Nwk Addr: 0x01cb, Status: Success
     Sequence Number: 72
     Status: Success (0)
     Nwk Addr of Interest: 0x01cb
     Simple Descriptor Length: 16
     Simple Descriptor
         Endpoint: 12
         Profile: Home Automation (0x0104)
         Application Device: Unknown (0x0302)
         Application Version: 0x0000
         Input Cluster Count: 3
         Input Cluster List
             Input Cluster: Basic (0x0000)
             Input Cluster: Identify (0x0003)
             Input Cluster: Temperature Measurement (0x0402)
or
 ZigBee Device Profile, Simple Descriptor Response, Nwk Addr: 0x01cb, Status: Success
     Sequence Number: 73
     Status: Success (0)
     Nwk Addr of Interest: 0x01cb
     Simple Descriptor Length: 18
     Simple Descriptor
         Endpoint: 10
         Profile: Home Automation (0x0104)
         Application Device: Unknown (0x0009)
         Application Version: 0x0000
         Input Cluster Count: 5
         Input Cluster List
             Input Cluster: Basic (0x0000)
             Input Cluster: Identify (0x0003)
             Input Cluster: On/Off (0x0006)
             Input Cluster: Scenes (0x0005)
             Input Cluster: Groups (0x0004)
Interestingly, I found that the Aeotec/ “smart” things hub was actually querying all my endpoints and getting a correct description of each one. Then it would apparently just throw all this information in the garbage and show me a thermostat..?
Ah well, at least it wasn’t my code. I finally moved dev over to Home Assistant and that traffic started out the same way, but then actually did the binds and gave me access to all inputs (with the correct types) and control over all outputs. Pretty awesome.
At some point, playing around with automations related to some simple sensor inputs, things weren’t behaving as well and as snappily as I’d hoped.
Debugging on the device showed that the sensing was doing all right, but somehow the home assistant UI was super sluggish.
Again, bare packet inspection to the rescue. With zigbee, your end can have inputs that are “bound” to another device, such that they’ll report changes. Cool. But it’s the receiver that decides how often they want to hear about your troubles.
Enter the Configure Reporting packet. Here I found the answer to my woes, in that the minimum interval between reports was being set to 30 seconds.
 ZigBee Cluster Library Frame, Command: Configure Reporting, Seq: 89
     Frame Control Field: Profile-wide (0x00)
         .... ..00 = Frame Type: Profile-wide (0x0)
         .... .0.. = Manufacturer Specific: False
         .... 0... = Direction: Client to Server
         ...0 .... = Disable Default Response: False
     Sequence Number: 89
     Command: Configure Reporting (0x06)
     Reporting Configuration Record
         Direction: Reported (0x00)
         Attribute: Present Value (0x0055)
         Data Type: Boolean (0x10)
     Minimum Interval: 30
     Maximum Interval: 900
Though changes to the sensor would eventually make their way up to the UI, it could take up to 30 seconds for the state to get reflected. Thus, to improve this would require setting the reporting interval on the controller side. At least this let me know where to look.
Those were the most useful to get me going. Otherwise, packets you focus on will mostly depend on what you’re trying to accomplish. For commands and state reporting, it’s nice to be tailing the pcap file in realtime, so you can see the stream of packets go by as you play with control and inputs. The colour scheme helps here and, if the channel is busy, filtering using the short 16-bit address in wireshark is as simple as
wpan.src16 == 0x01cb || wpan.dst16 == 0x01cb
using whatever address you see in the packets.
Hopefully this will get help you uncover what’s going really going on as you develop your own zigbee devices. Have fun!

